The Fragile State of Liquidity in the Bond Market
Timothy Yan & Mark Landis
|
KEY TAKEAWAYS
|
“The 2007–08 financial crisis was the biggest shock to the banking system since the 1930s, raising fundamental questions about liquidity risk.”
- FRBSF Economic Letter, March 14, 2012
We often hear about liquidity as something that is being provided to the financial system in order to stabilize markets. Much coverage goes to these additive measures, while less is dedicated to the times when it is taken away that can be just as important. There are two different types of liquidity - funding liquidity and market liquidity – which can create key risks for investors. Funding liquidity is the ease at which financial intermediaries can borrow[1], while market liquidity is how easily an asset or security can be bought or sold and converted to cash. Under normal conditions, investors expect that there will be ample liquidity in the marketplace for them to exit a position when they decide to sell. However, if the necessary liquidity is not available, the investor may be forced to sell at a price they might view as unfavorable if they can sell at all.
The potential for funding and market illiquidity represent risks that could now be hiding beneath the surface of markets, and we don’t have to look back far to see examples of how severely these forces can send shockwaves through the financial system. Regularly overlooked and underappreciated, liquidity is something that often seems to dry up when investors need it the most.
History Replete with Liquidity Crises
As a natural and recurring theme in markets, there are many examples of stressed conditions due to illiquidity. One of the factors that makes a liquidity crisis difficult to spot ahead of time is that they often rise out of what can appear to be normal, functioning markets. As something that does occur from time-to-time, we continually scan for warning signs – particularly in today’s environment. To better understand where we are currently, it may be helpful to examine the response to the most recent crisis and how policy makers’ actions could have serious ramifications going forward.
Figure 1: Timeline of Liquidity Crises
For Illustrative Purposes Only

In March of 2020, we saw severe strains across markets as initial fears of the COVID-19 pandemic cascaded through the economy (Figure 1). In response, the Fed took emergency measures to bolster the bond market and stabilize cash flows for businesses by making $1.5 trillion in short-term loans available. This provided companies access to borrowing in order to strengthen their balance sheets through the downturn. Companies took full advantage of this, leading to a boom in corporate issuance. In addition, the Fed pledged to buy as much debt as needed to support markets for Treasuries, mortgages, and for the first time in history, corporate bonds. This massive injection of liquidity returned markets to functioning in an orderly manner.
Going back further to 2008, the landscape for trading fixed income securities was forever changed by regulation enacted to safeguard Main Street from Wall Street. Previously, banks were a key source of liquidity to the bond market. As the result of a series of regulatory mandates in the US and abroad, banks are now required to hold larger capital positions to prevent their balance sheets from the major swings experienced in the past.
Figure 2: Bond Dealer Positions vs. Corporate Bond Market
For Illustrative Purposes Only

Source:
Primary Dealer Positions – Federal Reserve Bank of New York Primary Dealer Statistics, Positions greater than 1 year. Data includes asset-backed securities
Corporate Bond Market Outstanding – Securities Industry and Financial Markets Association (SIFMA), Federal Reserve
One of the lasting effects of the 2008 Financial Crisis is that banks now hold far fewer positions (as shown in Figure 2), making them less nimble to respond to investors’ requests to buy and sell securities. Regulation has left their ability to step in and provide liquidity at a small fraction of what it once was, as evidenced by dealer balance sheets at their lowest levels since the turn of the century. On the other end of the spectrum, the size of the bond market has continued to trend upward to new highs.
Bringing things back to the situation more recently, 2020 and 2021 were record years for high yield and investment grade issuance[2] as companies refinanced higher-cost obligations through the pandemic. This sharp rise was mirrored in the private markets, where assets hit a record $1.6 trillion in March 2022, according to a report by Intertrust Group, a trust and corporate management company based in the Netherlands. With this rise in issuance, the growing gap between dealer balance sheets and the size of the bond market is even more of a concern, especially when considering the current market landscape. Companies are staring down two negative quarters of GDP growth with a Fed that is committed to raising rates to combat inflation at its highest level in decades.
Market Backstops Missing in Action
A key reason that liquidity manifests itself differently in fixed income versus equities is that the bond marketplace is still over-the-counter and not exchange-traded. While some bonds trade frequently, others rarely trade, and during periods of volatility and stress, the liquidity challenges of these markets can be exacerbated.
In the past, dealers, and in extreme cases, the Fed, have stepped in as buyers during times of stress. The next time around, however, these longstanding backstops may face new and meaningful constraints. As highlighted above, regulations have significantly limited the amount of balance sheet dealers can use to hold positions. The Fed may also be unable to purchase assets as they have in the past if inflation is still elevated. This situation presents a liquidity mismatch which could greatly impact the price of positions and is a risk that should be taken seriously by investors.
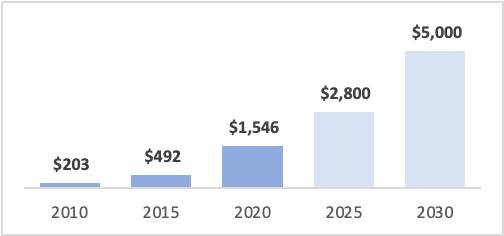
Figure 3: Actual and projected growth of global bond ETF AUM (in $Billions)
For Illustrative Purposes Only
Source:
BlackRock projection as of May 1, 2022. Subject to change.
One area where the market has evolved in a direction that can be useful for investors seeking liquidity is the advent of fixed income ETFs. The ease at which an investor can enter and exit thousands of bonds through a single ETF trade has helped this segment grow into one of the largest parts of the market in recent years. Since 2010, we have seen the space grow significantly in assets which are projected to more than double by the year 2030 (Figure 3). This structure has now been tested through volatile periods, providing liquidity and offering price discovery even when the underlying positions may not be trading regularly.
Conclusion
|
We believe the current economic backdrop of high inflation coupled with slowing growth can create challenges for investors as they try to navigate markets. The Fed faces a similarly precarious situation trying to raise interest rates enough to tame inflation without sending the economy into a prolonged recession. After confirming their commitment to the inflation side of their mandate, the Fed will be limited in how much accommodation they can offer in a volatile market. With this predicament for policymakers combined with the limited ability of dealers to provide liquidity, investors could be the ones left holding the bag in the event of an unorderly market selloff.
As we mentioned in our previous research note, Private Credit’s Canary in a Coal Mine, trying to time markets isn’t easy, particularly in today’s economic environment. Attempting this with a product or vehicle that may not be as liquid as perceived can be especially dangerous and have long-lasting impacts on a portfolio. While public and private credit markets have expanded, investors should fully account for the liquidity profile involved and how that may change during periods of stress if there are no willing buyers to provide price stability. While it may be next to impossible to predict exactly when the next period of market stress will occur, it is bound to come sooner or later. We believe investors can prepare themselves by looking under the hood of their current holdings and focusing on fixed income instruments that can maintain liquidity throughout the next crisis, whenever that may be.
[1] International Monetary Fund (IMF)
[2] “US Corporate Debt Issuance to Weaken as Rates Rise”, Fitch Ratings, July 20, 2022
Disclaimer:
Wavelength Capital Management, LLC (“Wavelength”) is an SEC-registered¹ investment adviser located in Connecticut. Wavelength may only transact business in those states in which it is notice filed or qualifies for a corresponding exemption from such requirements. Wavelength's website is limited to the dissemination of general information regarding its investment advisory services to United States residents residing in states where providing such information is not prohibited by applicable law. Accordingly, the publication of Wavelength's website on the Internet should not be construed as Wavelength's solicitation to effect, or attempt to effect, transactions in securities or the rendering of personalized investment advice for compensation over the Internet. Investing involves the risk of loss and investors should be prepared to bear potential losses. Past performance may not be indicative of future results and may have been impacted by events and economic conditions that will not prevail in the future. No portion of this commentary is to be construed as a solicitation to buy or sell a security or the provision of personalized investment, tax or legal advice. Certain information contained in this report is derived from sources that Wavelength believes to be reliable; however, the Firm does not guarantee the accuracy or timeliness of such information and assumes no liability for any resulting damages. For information pertaining to the registration status of Wavelength, please view the United States Securities and Exchange Commission’s website at www.adviserinfo.sec.gov. A copy of Wavelength's current written disclosure statement discussing Wavelength's business operations, services and fees is available from Wavelength upon written request. Wavelength does not make any representations as to the accuracy, timeliness, suitability, completeness or relevance of any information prepared by any unaffiliated third party, whether linked to Wavelength's website or incorporated herein, and takes no responsibility therefore. All such information is provided solely for convenience purposes only and all users thereof should be guided accordingly.
¹ SEC registration does not indicate a certain level of skill or training
Control Number: 15566565-UFD-8/20/2022